


NLOP: An Investment Where It Seems Almost Impossible to Lose Money
$NLOP

Why This Works
A great man once told me…if you can’t lose money, all the alternatives are pretty darn good!
$NLOP seems to be one of those rare investments we found where where it seems almost impossible to lose money. Quick overview of why:
NLOP is a REIT liquidation play - it was spun off from W.P. Carey a year ago and given the mandate to sell all buildings, pay off debt, and return rest to shareholders (more on the history below).
Today, at ~$31.75 per share, NLOP has a market cap of about $470M. There is $61M of recourse debt remaining, but the company has $20M of cash and likely another $48M of restricted cash that is about to become unrestricted. Our estimate is that after the latest building sales, NLOP is debt-free, and probably net cash of ~$7M, making the EV ~$460M.
Ok, so now what is this REIT worth? Let’s lay out a few options for value creation:
Option A - NLOP is not successful at selling any buildings because the office market is so bad, so our upside is just future cash flows and exit asset value of the empty buildings.
In this case, NLOP has around $370M of contracted rent left on existing leases (assuming no re-leases and no rent increases, both of which they have been doing relatively well so far FYI). NLOP is a triple net lessor, so though it does not have meaningful operating expenses for these properties, there are some tenant costs, management fees, G&A, and CapEx.
In Q3 2024, those costs were as follows - reimbursable tenant costs of $6.4M, property expenses of $3M, G&A of 1.8M, asset management fees of $1.4M, and CapEx of $1.9M and interest expense of $11.7M. Q3 2024 saw revenue of $31.5M, so upon first glance, doesn’t seem like a lot of cash generation. Rental cash flow post these costs would be ~$5.3M.
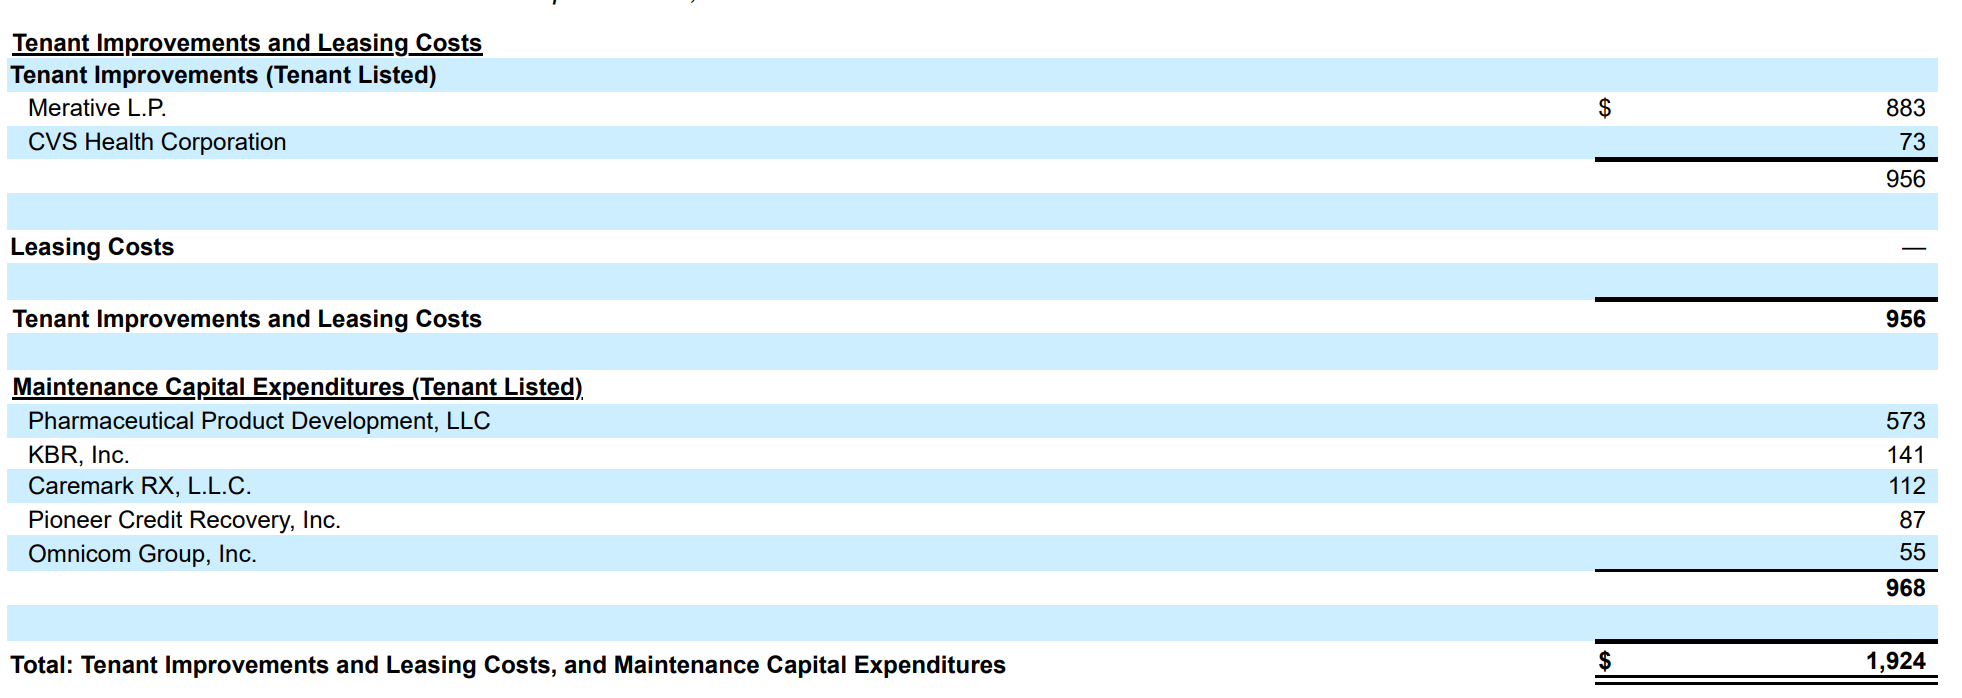
However, there have been a few important post-quarter developments. First off, we should debt-free given the recent asset sales and pay-down of our mortgage loan, so that $11.7M of interest goes away moving forward. Second, we know that with the asset sales, our rental revenue is also lower - we approximate ~$20M of rental revenue remaining per quarter moving forward. Third, some of these expenses are variable and based on the number of assets being managed. To be conservative, we’ll assume that G&A is fixed at 1.8M. Tenant costs and property expenses should be lower going forward given that NLOP sold 7 properties during/after Q3. We assume tenant costs of $4M and property expenses of $2M per quarter. NLOP’s annual report shows that asset management fees scale down as the properties are sold off, so let’s assume $1M per quarter moving forward. Finally, as shown in the table further down, NLOP filings show that ~50% of the CapEx in Q3 was related to releasing or sale activity and the other 50% was maintenance CapEx. We can then assume that go-forward CapEx is $900k per quarter.
Ok, so run that math, and we get run-rate quarterly rental cash flow of $10.3M - multiply that by 4 quarters and 5 years and you get $206M in rental cash flow to shareholders. Yes, a big delta from the $370M of contracted rent left.
However, let’s not forget, at the end of the lease periods, NLOP will have ~6M square feet of empty office space in a bunch of Class B/C buildings. Let’s say they fire sale those buildings at $40 per square foot (note vacant fire sales have been $50-90 per square foot so far). That is $240M of property value. Add that to the $206M of rent left, and we have $446M of “value”, in this severe downside or 3% downside from today’s EV.
And, this does not give NLOP any credit for future rent increases (many of which are baked into the rental contracts) or any releasing.
3% loss in an extreme downside case? We’ll take it.
Option B - NLOP fire sales buildings ASAP, but at really bad cap rates.
Let’s say they sell them at 12% cap rates (much higher than cap rates on transactions so far). $75M of annualized base rent left (excluding any properties with non-recourse property-level debt) - At a 12% cap rate, we have $625M of value. At 13%, we have $576M of value. At 10%, we have $750M of value. You get the gist. To lose money at today’s EV, the properties would need to sell at an average cap rate of 16% or higher.
Option C - our more likely scenario.
Over the next 2 years, NLOP sells down properties at an average cap rate of 10-11%. We also collect rent via dividend payments during this time frame. Our estimate is that we’d collect $50M of rent via dividends over the next 2 years while selling down properties, likely making $650M on the property sales. That is a total of $700M in value, or 55% upside from today’s price.
Our main takeaway is…it’s impossible to lose money on NLOP, and though the upside is likely capped in that 45-60% range, this is one of the best risk-adjusted returns out there.
Note - for this entire exercise, we are ignoring ABR and interest expense from the mortgaged properties, for sake of simplicity. In reality, this probably has additional upside, as these properties represent another $14.5M of ABR, $34M of cumulative rent vs. $5M of annual mortgage payments. At the end of the lease term, NLOP can just hand the keys back to the lenders for these.
Our math below along with further details on the opportunity:


History of the Asset
NLOP (Net Lease Office Properties) was spun off from W.P. Carey (WPC) in November 2023 as a pure-play liquidation vehicle for net lease office and industrial assets. Unlike traditional REITs that focus on growth, NLOP was explicitly designed to return cash to shareholders by selling assets over time.
This is a controlled liquidation, where proceeds from property sales will be distributed to shareholders.
As a REIT, NLOP is legally required to distribute most of its taxable income.
The market appears to be pricing this as a distressed REIT, when in reality, it owns valuable properties with clear asset coverage.
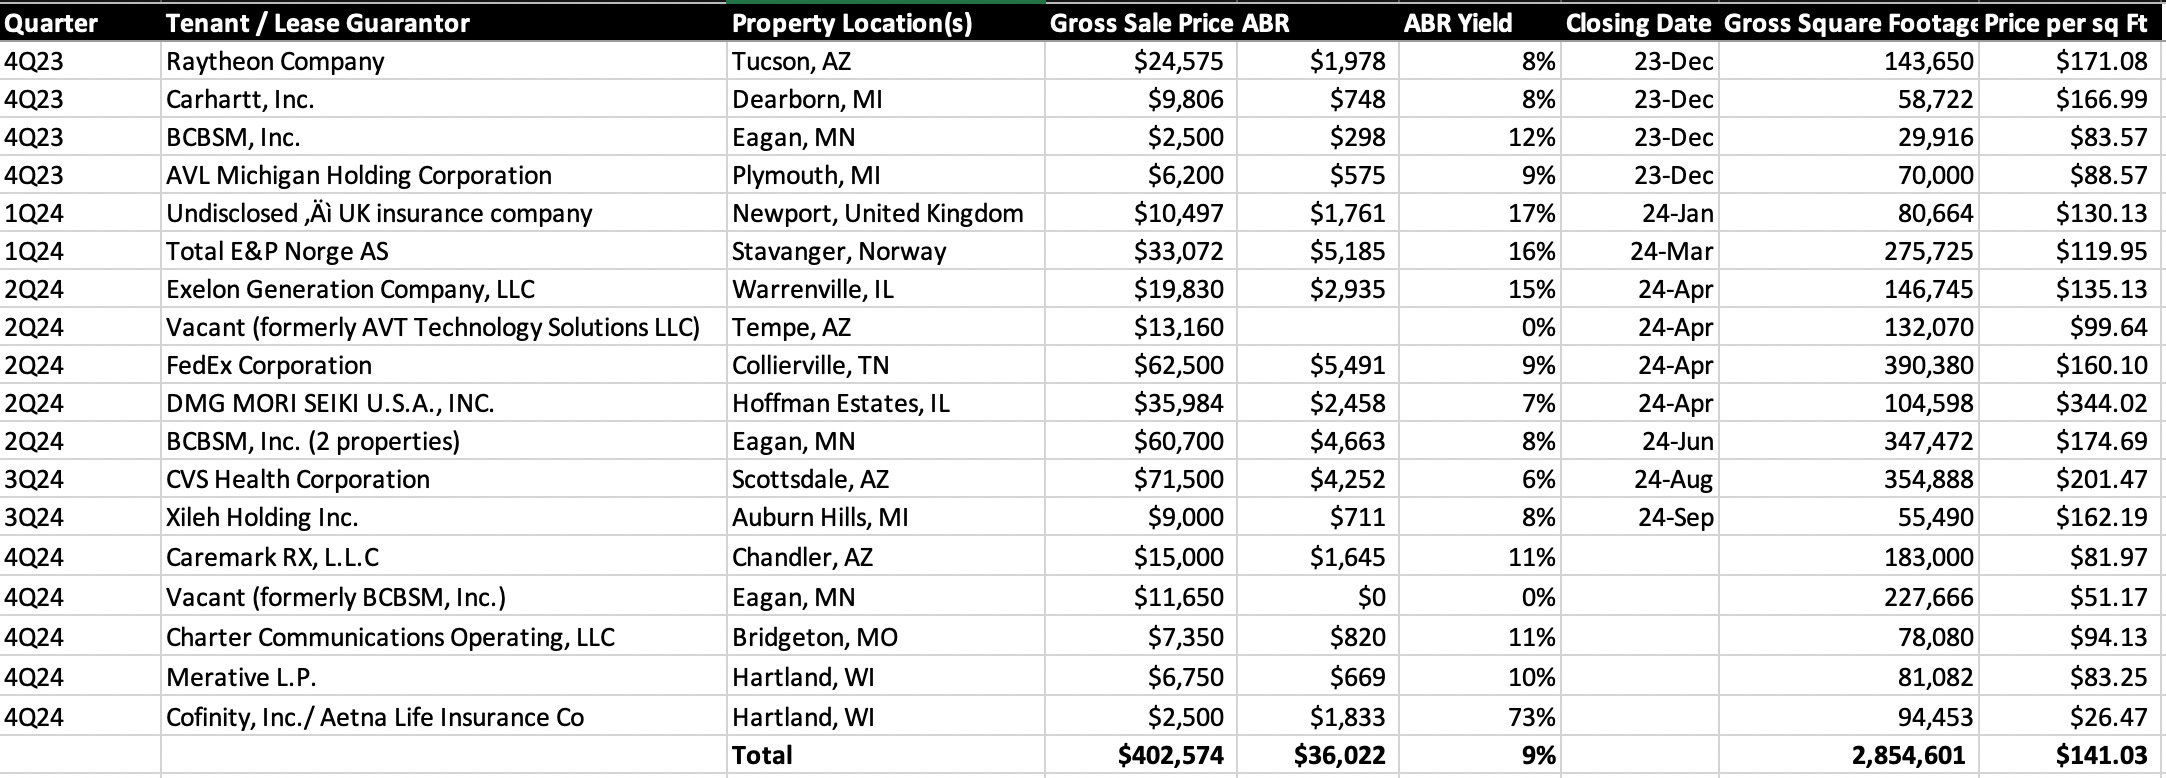
Recent Property Sales Suggest NAV is Higher
NLOP has already begun selling properties at cap rates far lower than the implied market valuation. Yes, there are some problematic properties with no WALT or are vacant, but we can apply very punitive cap rates to those and still come out positive (see full property by property analysis at the end).
Full Property Analysis


To better understand the liquidation potential, we categorize NLOP's properties into four distinct buckets:
Bucket 1: Long WALT (> 4 Years) – High Probability of Selling at Good Cap Rates (8-9%)
These properties have long-term leases in place, making them attractive to buyers seeking stable cash flow. Recent transactions suggest these could sell at cap rates between 8-9%.
Bucket 2: Short WALT – Expected to Sell at Higher Cap Rates (15-20%)
These properties have short lease terms remaining, making them riskier for buyers. As a result, they will likely trade at higher cap rates (15-20%).
Bucket 3: Prime Locations – High-Value Assets (Google and Omnicom)
Certain properties have premium locations and strong tenants (e.g., Google and Omnicom), making them much more desirable. These could fetch cap rates lower than 8%, providing significant upside to NAV.
Bucket 4: Vacant Properties
These properties do not currently generate rent and represent the most speculative portion of the portfolio. However, they also provide optionality for redevelopment, leasing, or sale at opportunistic prices. We value these based on a punitive price per square foot based on market rates for vacant buildings.
CapEx (50% of Q3 CapEx was for sales vs. maintenance)
NLOP has been renewing leases and capturing solid rents

Conclusion: A Classic Special Situation with a Clear Catalyst
At $31.90/share, NLOP is a low (dare we say zero?) risk, medium-upside bet where you get hard asset coverage and a clear return of capital strategy. The mispricing here is too good to ignore.
Disclosure: We are very long NLOP.
love the article. Great research! Where did you see that 50% of the capex is related to sale activity?
Brian, forgive my ignorance, but how are you calculating Cumulative Rent in your 'Full Property Analysis'? Is it ABR * WALT? Thanks!